


Imagine a message from your customer: “I have completed a work order on your app, but I don’t see it in my CMMS and now we’ve failed to report the this job done to the customer!”
Previously, you would think about what could go wrong, contact your engineers, and go through API server logs, while making an unhappy customer wait. Could it be that your customer selected wrong asset for that work order or do you have a bug in the integration?
That was previously.
Now that you use Makini’s Unified API, it got much easier - just go to “Monitoring” section on Makini! You will see the history of all API calls and webhooks for that customer. Simply enter the connection ID and filter the results.
Now you can log all API calls and track which components of your system respond to webhooks. This will allow you to easily discover that the problem was that the client never included this asset in the synchronization. Your response: ask the client to enable synchronization for this asset.
That's how easy it is to solve problems with Makini's API and Webhook logs. One section for every request, both to and from Makini.
Today, we are thrilled to launch our new API and webhook logs. It is intuitive, and available right now through your Makini Dashboard and is one of our core features to help you manage your integrations. See it in action live in the Makini Dashboard below.
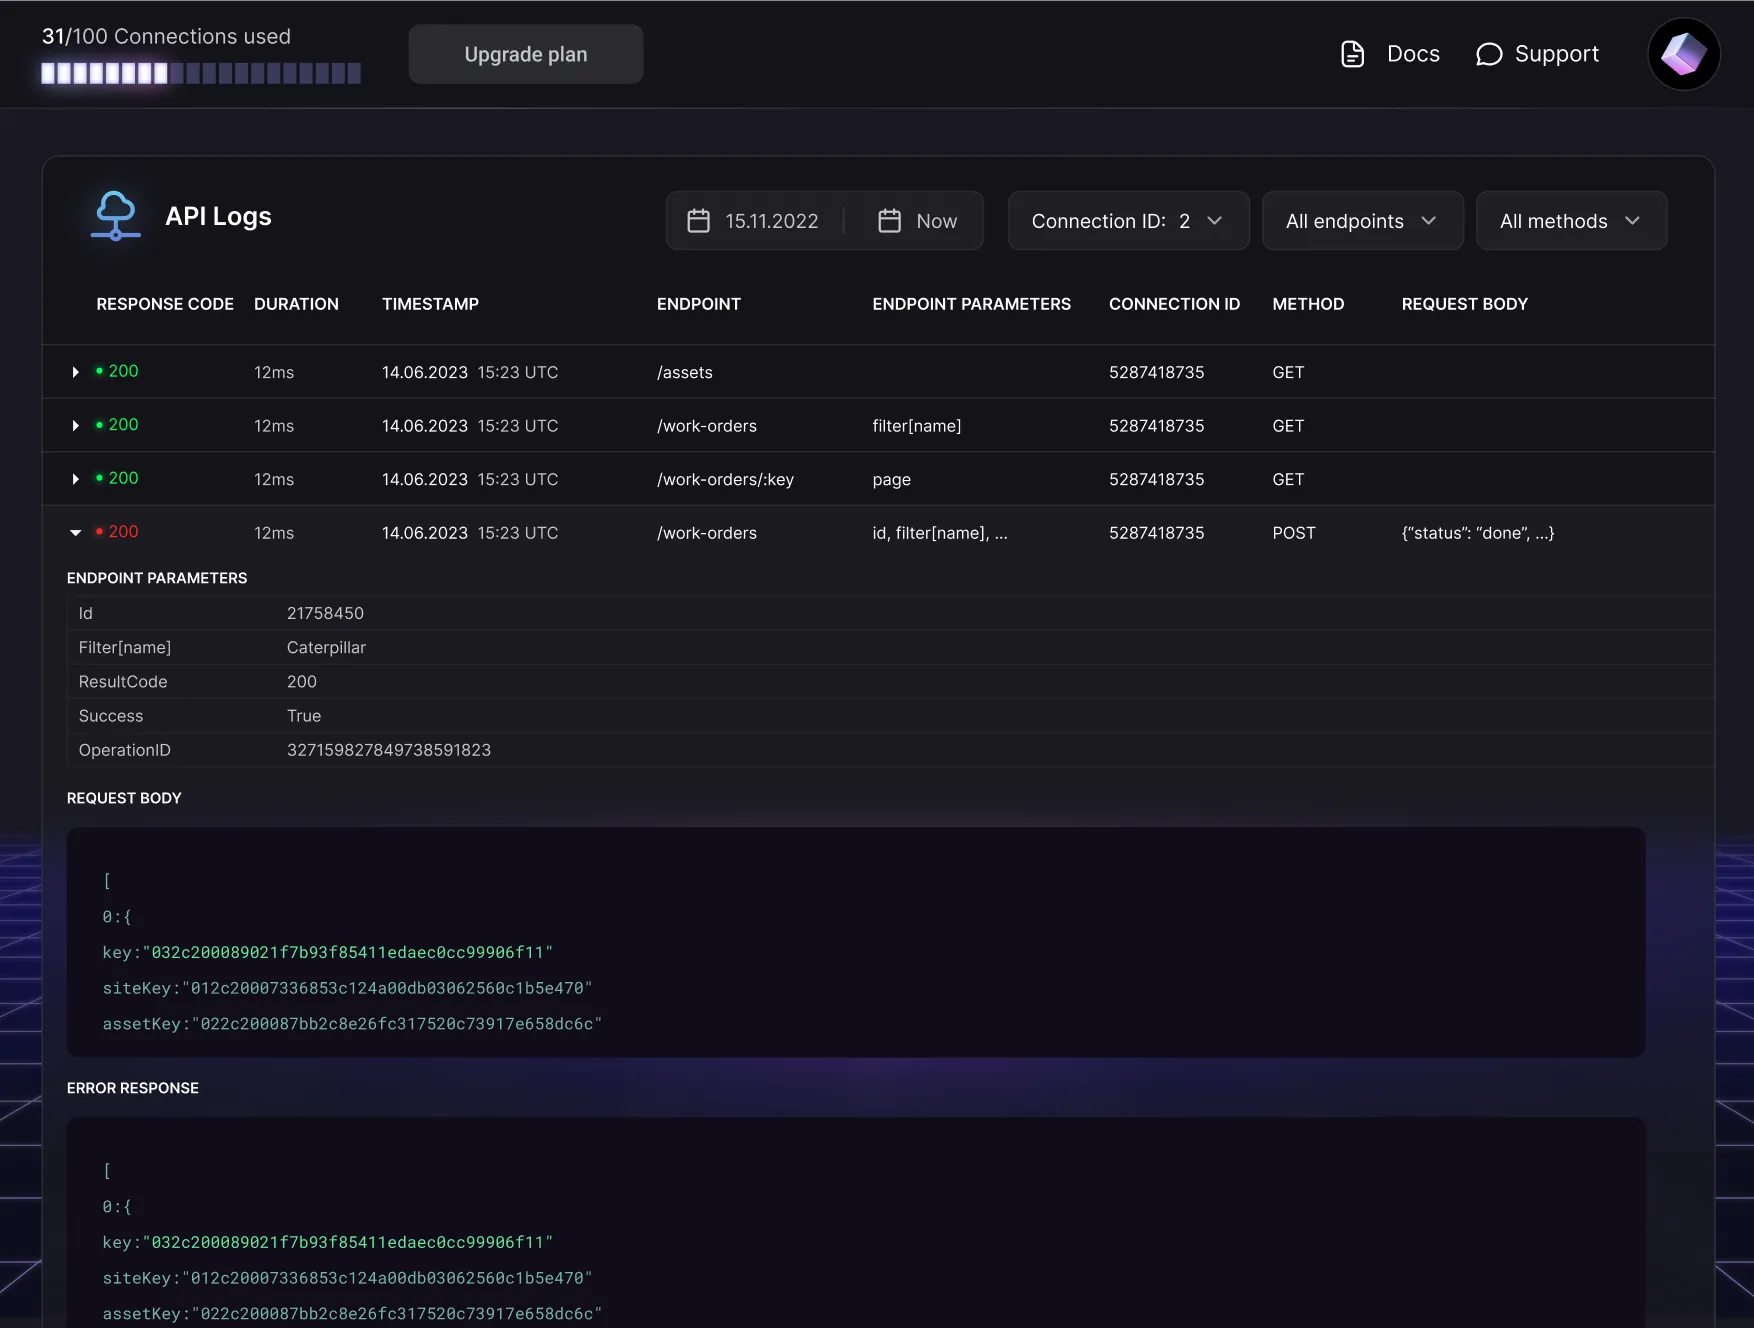
API Logs
API Logs help you understand and manage your API calls. Here’s what you can do with them:
- RESPONSE CODE: track successful requests or find potential issues with response codes.
- DURATION: monitor execution time of API calls to identify potential bottlenecks.
- TIMESTAMP: see timestamp of when API response is received.
- ENDPOINT: see which end-point you’ve called.
- ENDPOINT PARAMETERS: see end-point parameters you’ve had included into the call, like filtering and sorting.
- REQUEST BODY: see details of body you had in the API call.
Webhook Logs
Makini supports webhooks across all of its common data models. Webhook Logs provide valuable insights into events triggering your webhook.
- RESPONSE CODE: determine success or potential issues in event processing through response codes.
- CONNECTION ID: see which connection did the webhook come from.
- ENDPOINT: monitor which components of your system react to webhooks.
- EVENT: track the types of events initiating webhooks.
- TIMESTAMP: see timestamp of when the webhook was triggered.
Start Searching Now
API log search is now available to all Makini users. You can access it through your Makini Dashboard in the "Monitoring" section.
Some of our customers benefit from longer retention periods for Logs. If you’re interested in learning more, reach out to a member of our Sales team.
So, if you need to debug API interactions or ensure comprehensive API audit logs, Makini can help you with that. Learn how to effectively debug API calls and improve your system's performance today with our advanced API logging and monitoring solutions.
You can debug API calls, analyze API audit logs, and ensure complete control over the integration processes.


.jpg)


